Missing Values and Split Apply Combine#
This lesson focuses on reviewing our basics with pandas and extending them to more advanced munging and cleaning. Specifically, we will discuss how to load data files, work with missing values, use split-apply-combine, use string methods, and work with string and datetime objects. By the end of this lesson you should feel confident doing basic exploratory data analysis using pandas.
OBJECTIVES
Read local files in as
DataFrameobjectsDrop missing values
Replace missing values
Impute missing values
Use
.groupbyand split-apply-combineExplore basic plotting from a
DataFrame
import os
import numpy as np
import pandas as pd
import matplotlib.pyplot as plt
import seaborn as sns
Missing Values#
Missing values are a common problem in data, whether this is because they are truly missing or there is confusion between the data encoding and the methods you read the data in using.
ufo_url = 'https://raw.githubusercontent.com/jfkoehler/nyu_bootcamp_fa25/refs/heads/main/data/ufo.csv'
#create ufo dataframe
# examine ufo info
<class 'pandas.core.frame.DataFrame'>
RangeIndex: 80543 entries, 0 to 80542
Data columns (total 5 columns):
 #   Column           Non-Null Count  Dtype
---  ------           --------------  -----
 0   City             80492 non-null  object
 1   Colors Reported  17034 non-null  object
 2   Shape Reported   72141 non-null  object
 3   State            80543 non-null  object
 4   Time             80543 non-null  object
dtypes: object(5)
memory usage: 3.1+ MB
# one-liner to count missing values
# drop missing values
# still there?
# fill missing values
# most common values as a dictionary
# replace missing values with most common value
Problem#
Read in the dataset
churn_missing.csvfrom our repo as aDataFrameusing the url below, assign to a variablechurn_df
churn_url = 'https://raw.githubusercontent.com/jfkoehler/nyu_bootcamp_fa25/refs/heads/main/data/churn_missing.csv'
churn_df = ''
Are there any missing values? What columns are they in and how many are there?
What do you think we should do about these? Drop, replace, impute?
groupby#
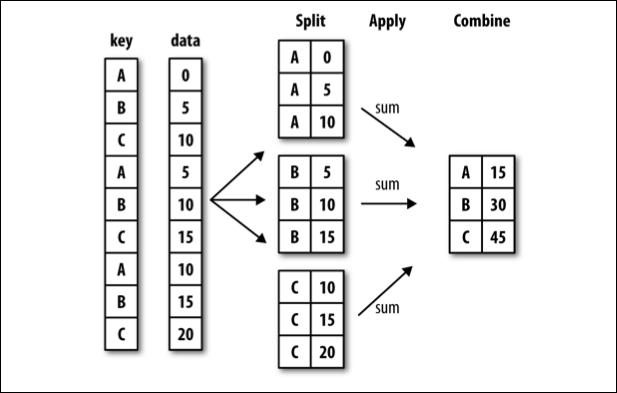
Often, you are faced with a dataset that you are interested in summaries within groups based on a condition. The simplest condition is that of a unique value in a single column. Using .groupby you can split your data into unique groups and summarize the results.
NOTE: After splitting you need to summarize!

# sample data
titanic = sns.load_dataset('titanic')
titanic.head()
| survived | pclass | sex | age | sibsp | parch | fare | embarked | class | who | adult_male | deck | embark_town | alive | alone | |
|---|---|---|---|---|---|---|---|---|---|---|---|---|---|---|---|
| 0 | 0 | 3 | male | 22.0 | 1 | 0 | 7.2500 | S | Third | man | True | NaN | Southampton | no | False |
| 1 | 1 | 1 | female | 38.0 | 1 | 0 | 71.2833 | C | First | woman | False | C | Cherbourg | yes | False |
| 2 | 1 | 3 | female | 26.0 | 0 | 0 | 7.9250 | S | Third | woman | False | NaN | Southampton | yes | True |
| 3 | 1 | 1 | female | 35.0 | 1 | 0 | 53.1000 | S | First | woman | False | C | Southampton | yes | False |
| 4 | 0 | 3 | male | 35.0 | 0 | 0 | 8.0500 | S | Third | man | True | NaN | Southampton | no | True |
# survival rate of each sex?
# survival rate of each class?
# each class and sex survival rate
# working with multi-index -- changing form of results
# age less than 40 survival rate
less_than_40 = ''
Problems#
tips = sns.load_dataset('tips')
tips.head(2)
Average tip for smokers vs. non-smokers.
Average bill by day and time.
What is another question
groupbycan help us answer here?
Plotting from a DataFrame#
Next class we will introduce two plotting libraries – matplotlib and seaborn. It turns out that a DataFrame also inherits a good bit of matplotlib functionality, and plots can be created directly from a DataFrame.
url = 'https://raw.githubusercontent.com/evorition/astsadata/refs/heads/main/astsadata/data/UnempRate.csv'
unemp = pd.read_csv(url)
#default plot is line
unemp.plot()
unemp.head()
unemp = pd.read_csv(url, index_col = 0)
unemp.head()
unemp.info()
unemp.plot()
unemp.hist()
unemp.boxplot()
#create a new column of shifted measurements
unemp['shifted'] = unemp.shift()
unemp.plot()
unemp.plot(x = 'value', y = 'shifted', kind = 'scatter')
unemp.plot(x = 'value', y = 'shifted', kind = 'scatter', title = 'Unemployment Data', grid = True);
More with pandas and plotting here.
datetime#
A special type of data for pandas are entities that can be considered as dates. We can create a special datatype for these using pd.to_datetime, and access the functions of the datetime module as a result.
#ufo date column
#make it a datetime
#assign as time column
#investigate datatypes
#set as index
#sort the values
#groupby month and average
Data Resources#
NYU has a number of resources for acquiring data with applications to economics and finance here.
See you Thursday!

