Homework 2: Plotting Functions and Sequences
Contents
Homework 2: Plotting Functions and Sequences#
OBJECTIVES
Use Python to define and plot functions
Differentiate between linear, quadratic, exponential, and trigonometric sequences
Relate functions to data
Problem 1: Importing Libraries#
Run the cell below to load in the numpy and matplotlib libraries.
import numpy as np
import matplotlib.pyplot as plt
Problem 2: Using a function#
Below, the function \(s(x) = x^2\) is defined. Use the function to evaluate \(f(100)\).
def s(x):
    return x**2
#your answer here
Problem 3: Using np.arange#
Use the np.arange function to create the following sequences below:
a. \(x1 = [0, 1, 2, 3, ..., 9, 10]\)
b. \(x2 = [10, 10.1, 10.2, ..., 10.9, 11]\)
c. \(x3 = [0, 0.01, 0.02, 0.03, ..., 9.98, 9.99, 10.0]\)
d. \(x4 = [-\pi, -\pi/2, 0, \pi/2, \pi]\)
# answer for x1
# answer for x2
# answer for x3
# answer for x4
Problem 4: Defining Functions#
Use code cells to define each of the following functions:
\(f(x) = \frac{1}{x^2}\)
\(g(x) = 3x + 1\)
\(h(x) = \frac{x^2 - 9}{x + 3}\)
#f
#g
#h
Problem 5: Plotting functions#
Use x defined below to create a plot for the functions \(f(x), g(x)\), and \(h(x)\) from problem 4 below.
x = np.arange(-5, 5, .1)
#plot f
#plot g
#plot h
Problem 6: From words to graphs#
For each of the problems below, your goal is to represent the situation as a closed form function. Plot the function on an appropriate domain.
Steve owns a Tesla car. When he leaves his house it has a charge of 70 units. Every mile Steve travels consumes .23 units from the battery. Let \(q(x)\) represent the amount of charge after \(x\) miles.
A student borrows \\(10,000 from an online bank with a great social media advertising team. He has to pay the bank back at simple interest, calculated as .6% per month. Determine an equation that represents the balance after \)n\( months assuming no payments. Can you incorporate a term to represent a fixed monthly payment in the amount \)p\( and see how long it would take to pay off the loan making \\\)200 monthly payments?
A company manufactures bags. The total cost for a single bag to be made with both materials and labor is \\(18. The company also has expenses of \\\)5,000 per month for rent, insurance, and utilities that are independent of the number of bags made. Determine a function \(b(x)\) that determines the monthly cost of the business when \(x\) bags are produced.
Problem 7: Graphs to Symbols#
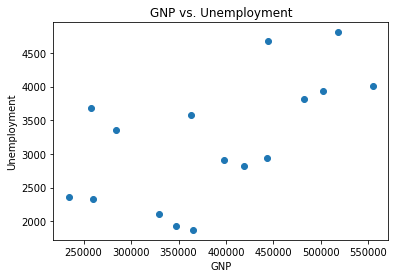
Below, a dataset containing basic macroeconomic variables displayed below is loaded and plotted. Approximate by eye stimate a linear function that models the data? This should be of the form \(f(g) = \text{unemployment}\) where \(g\) is the GNP.
import statsmodels.api as sm
longley = sm.datasets.longley.data.load_pandas()
data = longley.data
data.head()
| TOTEMP | GNPDEFL | GNP | UNEMP | ARMED | POP | YEAR | |
|---|---|---|---|---|---|---|---|
| 0 | 60323.0 | 83.0 | 234289.0 | 2356.0 | 1590.0 | 107608.0 | 1947.0 |
| 1 | 61122.0 | 88.5 | 259426.0 | 2325.0 | 1456.0 | 108632.0 | 1948.0 |
| 2 | 60171.0 | 88.2 | 258054.0 | 3682.0 | 1616.0 | 109773.0 | 1949.0 |
| 3 | 61187.0 | 89.5 | 284599.0 | 3351.0 | 1650.0 | 110929.0 | 1950.0 |
| 4 | 63221.0 | 96.2 | 328975.0 | 2099.0 | 3099.0 | 112075.0 | 1951.0 |
plt.scatter(data['GNP'], data['UNEMP'])
plt.xlabel('GNP')
plt.ylabel("Unemployment")
plt.title('GNP vs. Unemployment');
Problem 8: Table to Symbols#
Below is a table of U.S. automobiles through time. Your goal is to plot the data and determine a linear function to model the data.
Year |
Automobiles |
|---|---|
1940 |
27.5 |
1950. |
40.3. |
1960 |
61.7 |
1970 |
89.3. |
1980 |
121.6. |
1986. |
135.4 |
Use your function to predict how many automobiles there would be in the year 2000.
Problem 9: Supply and Demand#
Use the table below to answer the following questions.
Price |
Demand |
Supply |
|---|---|---|
120. |
50 |
36 |
150 |
40 |
40 |
180. |
32 |
48 |
210 |
28 |
56 |
240 |
24 |
70 |
Plot price vs. demand.
Plot supply vs. demand.
At what price is the supply equal to 100? Explain.
If the price is 130, what would the quantity supplied and demanded be? Who is in a better position here – producer or consumer?
If the price is 200, what would the quantity supplied and demanded be? Who is in a better position here – producer or consumer?
Problem 10: Pascal’s Triangle#
Watch the Numberphile video below on patterns in Pascal’s triangle. Identify one pattern you find interesting and discuss this below. Create a plot of the pattern (sequence) below.
from IPython.display import YouTubeVideo
YouTubeVideo(id = '0iMtlus-afo')